
Macroeconomics & financial crisesexplainer
How The Economic Machine Works by Ray Dalio
Principles by Ray Dalio
Documented HN sourceHN 19.0
Quick Take
HN repeatedly recommends it as the best layperson overview of debt, credit and economic cycles.
Data visualization & information design
BBC · Discussed on HN from 2010 to 2023
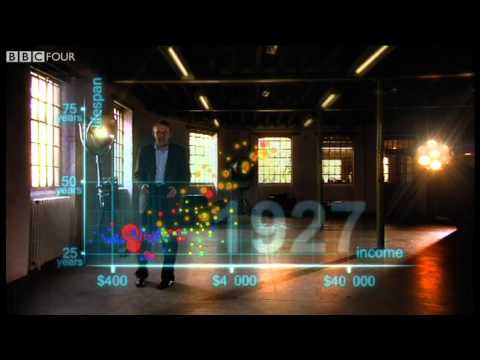
Hans Rosling uses augmented-reality animation to show 200 countries over 200 years in four minutes, built from 120,000 data points. It tracks life expectancy and income to show the world's development.
Read the notesReassuring perspective that human progress continues slowly in the background
“anytime I feel similar to the OP, I watch something by Hans Rosling [1]”Read the original HN comment
somethoughts · 2023-01 · 10 recommenders across 12 months
Principles by Ray Dalio
HN repeatedly recommends it as the best layperson overview of debt, credit and economic cycles.
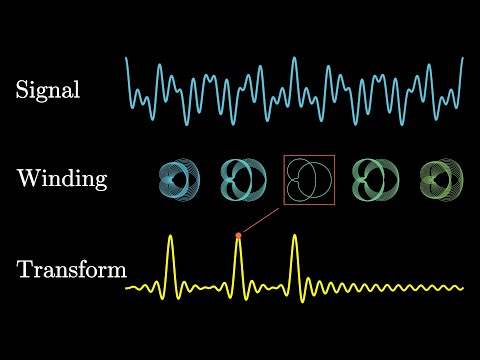
HN's default recommendation for understanding the Fourier transform intuitively; many say it was the explanation that made it click.

US Auto Industry
Held up as a marvel of pedagogy and the best explanation of differentials, recommended again and again.