
recthret · 2011-01
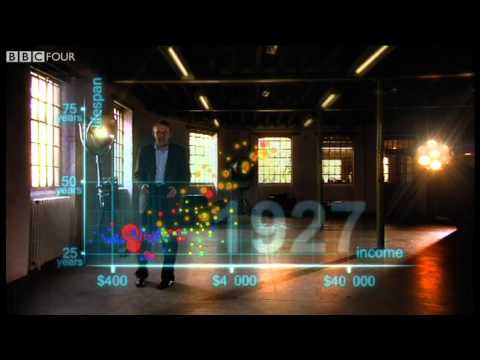
Concise data visualization of global development and capitalism's gains.
“Concisely sums up everything good about free-market capitalism.”Open comment #2151277
Mathematics, machine learning & data
BBC · Discussed on HN from 2010 to 2023
Editorial context · source-attributed
Across the sampled HN recommendations, people specifically point to Concise data visualization of global development and capitalism's gains. and Animated visualization of 200 years of life expectancy by country.
The recorded HN source is “anytime I feel similar to the OP, I watch something by Hans Rosling [1]” — a useful perspective from somethoughts in 2023-01, rather than a claim that every Hacker News reader agrees.
Alongside recommendations, the export retains a reference mention from chroma (2010-12): “The original video link ( [VIDEO] ) was submitted 5 days ago ( [LINK] ). Then a slightly different url ( [VIDEO] ) was submitted 10 hours ago ( [LINK] ) It seems quite unfair to me that the person who submitted this content first, and did so without linking to their own blog, gets none of the recognition and karma. While 100% of sthomps submissions ( [LINK] ) are links to his own blog, where he mirrors or links to the original content. I just said it ( [LINK] ) but I'll say it again: I think this is a flaw in HN's ranking scheme. If the original link isn't upvoted quickly, it never gets on the front page. After that, the rewards (recognition, traffic, and karma) go to people who mirror the original content or simply link to it from their own websites.” This is context, not proof; use the linked discussion to inspect the original thread.
Curious viewers exploring global development. Its upstream classification is data visualization & information design, while this Explorer page groups it with related material in mathematics, machine learning & data.
Concise data visualization of global development and capitalism's gains.
“Concisely sums up everything good about free-market capitalism.”Open comment #2151277
Animated visualization of 200 years of life expectancy by country
“a far cooler visualization in my book!”Open comment #3180046
Short view of global progress showing poor countries improving
“For perspective, take 5 minutes to watch”Open comment #6040231
The original video link ( [VIDEO] ) was submitted 5 days ago ( [LINK] ). Then a slightly different url ( [VIDEO] ) was submitted 10 hours ago ( [LINK] ) It seems quite unfair to me that the person who submitted this content first, and did so without linking to their own blog, gets none of the recognition and karma. While 100% of sthomps submissions ( [LINK] ) are links to his own blog, where he mirrors or links to the original content. I just said it ( [LINK] ) but I'll say it again: I think this is a flaw in HN's ranking scheme. If the original link isn't upvoted quickly, it never gets on the front page. After that, the rewards (recognition, traffic, and karma) go to people who mirror the original content or simply link to it from their own websites.
Open comment #1974810Hans Rosling uses augmented-reality animation to show 200 countries over 200 years in four minutes, built from 120,000 data points. It tracks life expectancy and income to show the world's development.
Original HackerTube classification: Data visualization & information design.
Reassuring perspective that human progress continues slowly in the background
“anytime I feel similar to the OP, I watch something by Hans Rosling [1]”Read the original HN comment
somethoughts · 2023-01 · 10 recommenders across 12 months

HN's go-to recommendation for learning linear algebra intuition, repeatedly credited with making concepts click and complementing textbooks.

HN treats it as the best starting point for really understanding backprop and neural nets, because Karpathy explains the why with intuition and builds everything in code.
Principles by Ray Dalio
HN repeatedly recommends it as the best layperson overview of debt, credit and economic cycles.